Argentina
produces two of the most demanded infusions in the local market: Tea and
yerba mate (mate tea). Both are present in the majority of Argentine homes
and are consumed at any time of the day. On the other hand, both share
the same production area: Misiones and the northeast of Corrientes.
The tea plant (Camellia sinensis)
is a species originated in the East that, at present, is cultivated and
consumed in the five continents. With the same raw material (shoots and
leaves of the above mentioned species) diverse final products are obtained,
according to the method of industrialization, botanic variety, growing
technologies, season, or crop type. The best known tea varieties are black
tea, green tea, red tea and white tea.
It is important to point out that
the region where Argentine tea is grown is the farthest south in the world,
and produces mainly black tea. The principal destination of the country’s
production is the export market, and year after year, Argentina is gaining
importance as tea producing and exporting country.
The yerba mate (Ilex paraguariensis
Saint Hilaire) originated in the subtropical regions of Argentina, Brazil
and Paraguay, and its natural distribution area is restricted to those
countries. It is consumed in various ways: in Argentina the most traditional
form consists in placing the yerba mate in a specific container, pour
hot water on it and suck the infusion by means of a special tube. When
the weather is hot the water used may be cold. The mate tea may be drunk
also from a cup, in which case the beverage is prepared in a way similar
to tea.
This product forms part of a deep-rooted
tradition in Argentina and neighboring countries, and has an enormous
potential for increasing its insertion in the world market.
PRODUCTION
-
Tea growing takes place
in the five continents, and each zone originates a product with differential
qualities as a result of special agro-ecological conditions, farming
techniques and industrialization.
-
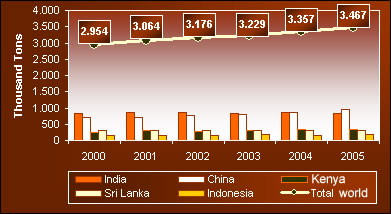
World production of tea shows
a positive trend: from 2000 to 2005, it registered a 17% volume growth.
This is related to record crops in China, Vietnam, Sri Lanka and Kenya
in 2005.
|
|
| World
production of Tea
Years 2000 – 2005 |
| |
..Source:
Food Industry Administration based on data from FAO.
|
|
-
Considering the world context,
more than half of total tea production volume is contributed by India
and China. From 2000 to 2004, India obtained an average of 27% of
global volume, followed by China which produced 24% in the average.
In 2005 this Asian country became the biggest world producer, contributing
28% to total production, followed by India with 24%.
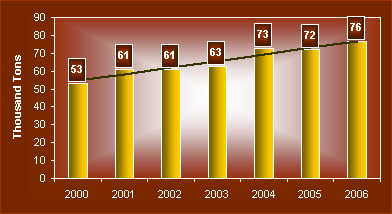
-
Argentina has been following
the world trend and has exceeded global growth registering a 44% increase
in production volume in the period 2000 - 2006.
|
|
| Tea
production in Argentina in volume
Years 2000 – 2006
|
| |
..Source:
Food Industry Administration based on data from
..COPROTÉ.
|
|
-
Volume growth in local
production is the result of technological improvements such
as: adjustments in fertilization and harvesting techniques,
and incorporation of clone plantations with high productivity
and product quality.
-
Argentina dedicates
around 40,000 hectares to this industrial crop. Ninety five
percent of the country’s production area is located in
the province of Misiones and the rest in Corrientes.
-
It is important to
point out that Argentine tea stands out due to the color qualities
it contributes to the different blends, and because it produces
a translucent infusion that may be drunk either cold or hot.
-
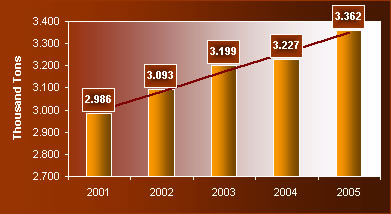
According to data provided
by the Intergovernmental Group on Tea – FAO, global tea consumption
presents a positive trend, as it registered a 13% increase in the
period 2001 - 2005. In this last year world consumption increased
to 3.36 million tons.
|
| World
consumption of Tea in volume
Years 2000 – 2005 |
| |
..Source:
Food Industry Administration based on data from the
..Intergovemmental
Group on Tea, FAO.
|
|
-
India maintains its position
as world biggest tea consumer. In 2005, it consumed 757,000 tons,
which represents 22.5% of world total. It was followed by China (20.1%)
and by the Russian Federation (5.4%) in the third place. Then follow
Japan 4.5%, Pakistan 4%, United Kingdom 3.8% and the United States
(main destination of the Argentine tea) 3%.
-
Considering variances registered
in the biggest world consumers (India, China and Russian Federation),
growth rates of 13%, 36% and 15% respectively can be observed in the
period 2001-2005.
-
The magnitude of local demand
is far from figures registered in top world consumers. In our country,
the estimated average consumption from 2000 to 2006 was 3,174 tons,
with a 6% increase in 2005 and 2006.
EXPORTS
-
There was a slight increase
in the tea business volume worldwide in 2005, as global exports reached
1.53 million tons in that year compared to 1.52 million tons in 2004.
In 2005, shipments from all major exporters increased, except for
India, according to data from the Intergovernmental Group on Tea,
FAO. Information from the same source indicates that Kenya continued
to be the main exporter in 2005, exceeding the exports of Sri Lanka
for two consecutive years.
-
In Argentina, tea is the
most exported infusion, considering tea, yerba mate and coffee. In
2006 tea had a share of 70.5% in volume and of 65.9% in total sales
dollars. At the same time, our country sells around 90% of its tea
production to foreign markets, where the United States and Chile stand
out as predominant destinations.
|
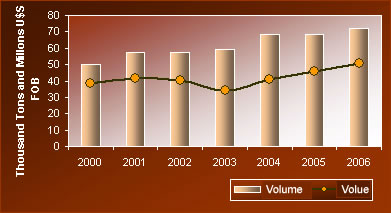
| Exports
of Argentine Tea in volume and FOB value
Years 2000 – 2006 |
| |
..Source:
Food Industry Administration based on data from Customs
..and
AFIP.
|
|
-
Domestic tea exports have
increased 44% in volume, starting with 50,072 tons in 2000 to reach
71,987 tons in 2006. These transactions have also generated a 32%
income increase in the same period. Total tea sales abroad amounted
to 30.5 million dollars in 2000 and to 50.7 million dollars in 2006.
-
Argentine tea exports include
only an average of 1% of green tea, and the rest corresponds to black
tea that is mainly sold in containers of more than 3 kilograms.
IMPORTS
-
World imports of tea increased
1.9% in 2005 compared to the previous year, reaching 1.39 million
tons. This trend reflected import increases in the Russian Federation
and in Pakistan, Libya and Sudan. United States imports, main market
for Argentine tea, also registered an increase.
-
In Argentina, tea imports
are notably lower than exports, in volume as well as in dollars, which
indicates our country is a net exporter. Average volume for the period
2000 – 2006 reached 326.3 tons and the volume acquired from
foreign markets in the last year under analysis amounted only to 319
tons.
-
Average values paid in the
seven years being analyzed amounted to 1.03 million U$S CIF.
-
The most outstanding origins
of Argentine tea imports are: Brazil, China, Kenya, Sri Lanka and
United Kingdom. In 2006 Brazil contributed 37% of the total volume
of tea purchased by Argentina, followed by China (29.4%), Sri Lanka
(19.2%), Chile (5%) and United Kingdom (4.1%). However, the British
nation concentrated the biggest part of our country’s total
imports in dollars: 24.1%. Sri Lanka received 19.9% and Brazil 16.9%.
PRODUCTION
-
The yerba mate is a highly
consumed product in Argentina, as its consumption constitutes a deep-rooted
tradition, and is therefore present in most Argentine homes. It is
cultivated for business purposes in only three countries: Argentina,
Brazil and Paraguay, in coincidence with its natural dissemination
area. Our country is the biggest world producer and exporter.
-
According to information
provided by the Yerba Mate National Institute (INYM in Spanish), the
production of green leaves –raw material from the yerba mate-
has registered an 7% reduction from 2005 to 2006 (738,707.7 and 684,656.2
tons respectively).
-
On the other hand, the amount
of yerba mate ready for distribution in the local market has also
shown a retraction trend. In 2005, production reached 238,881.5 tons,
while in 2006 this figure decreased to 225,044.9 tons (-5.8%).
EXPORTS
-
By virtue of the high consumption
registered in the domestic market, Argentine exports of yerba mate
represent only 10 to 15% of the country’s total production.
-
However, the average income
generated by sales to foreign markets, in the period 2000 –
2006, amounted to 21.5 million dollars FOB.
|
|
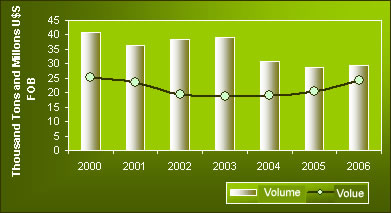
| Exports
of Argentine yerva mate in volume and value
Years 2000 – 2006 |
| |
..Source:
Food Industry Administration based on data from DGA and AFIP.
|
|
-
In the period
2003 - 2004 there was a retraction in sold volumes. However, in 2005
and 2006 there was a 3% recovery (28,575 and 29,408 tons respectively).
-
Relative
to total income, as a result of that business flow, in the period
2003 – 2006 there was an increase of 31%.
-
Siria was
positioned as the main destination market in the years under analysis,
except in 2001, when Brazil was the principal foreign market for the
Argentine yerba mate. Since 2002 Siria’s volume share increased
from 42% to almost 59%.
-
Chile maintains
its position as second export market, and has increased its share
in a sustained way since 2003. From 2005 to 2006 sales to this country
increased measured in volume as well as in dollars. Brazil also showed
a share increase in 2006 compared to 2005.
|
|
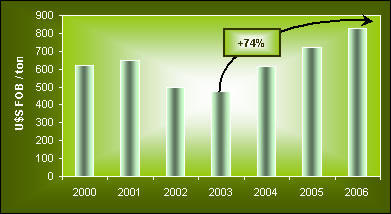
| Average
export price in US$ FOB/Ton
Years 2000 – 2006 |
| |
..Source:
Food Industry Administration based on data from DGA and AFIP.
|
|
-
In the period 2000 –
2003 average yerba mate export prices followed a negative trend. Later
on, this trend was reverted. The average export price increased 74%
in the period 2003 - 2006, from 474 U$S FOB/ton to 825 U$S FOB/ton.
It must be pointed out that in this period, the average export price
paid by Syria increased 51% (555.1 U$S FOB/ton in 2003 and 840.9 U$S
FOB/ton in 2006).
IMPORTS
-
Yerba mate imports are insignificant
compared to export volumes. In 2000 imports amounted to 858 tons,
this representing the biggest volume in the period under analysis
(2000 – 2006). Amounts continued to decrease until 2003 (62
tons), but in the three following years there were increases of 83,
120 and 280 tons.
-
Amounts paid in the period
2000 – 2006 reached 320,134 U$S CIF in the average. This sum
was exceeded in 2006 when 432,631 U$S CIF were paid in total for the
280 tons of yerba mate imported.
-
Brazil, Uruguay and Paraguay
have been the origin of Argentine imports, but small amounts were
also purchased from Syria and Germany. Brazil has been the most important
supplier of yerba mate, followed by Uruguay, except in 2003 when the
latter was the only supplier of the total volume imported.
PROSPECTS
The infusion industry
sector as a whole presents favorable prospects.
In the first place, the high dynamism shown by tea production, consumption
and business flow at world level offers a favorable scenario to strengthen
the role of our country as tea producer and exporter.
On the other hand,
the Argentine yerba mate sector is striving to consolidate its world leadership
as producer and exporter of this product so traditional in Argentina,
through the promotion of its consumption, at national and international
level, and the search for a firm insertion in new markets. |